 GroundWater Analyst: 3D groundwater modelling from borehole records
3D groundwater models from borehole records: the water table, the top of bedrock, the aquifer layers and every borehole under real terrain, in any browser.
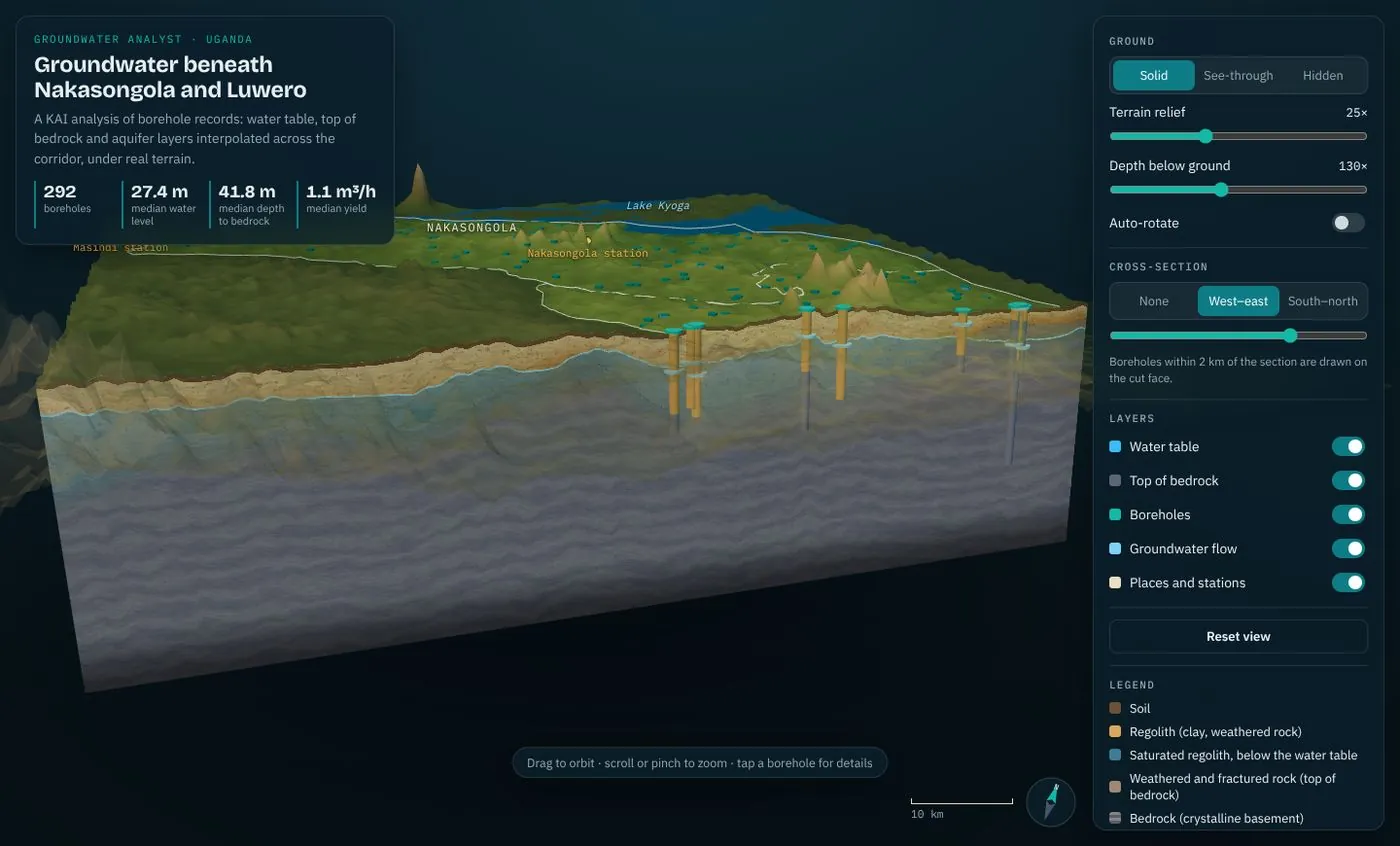
GroundWater Analyst software
3D groundwater models from borehole records
Most groundwater decisions in East Africa are still made from a borehole register and a geophysical line. The records that would show where water is shallow, where bedrock is deep and where earlier boreholes failed sit in files that are never turned into a picture, so dry and low-yield boreholes keep costing the full drilling price.
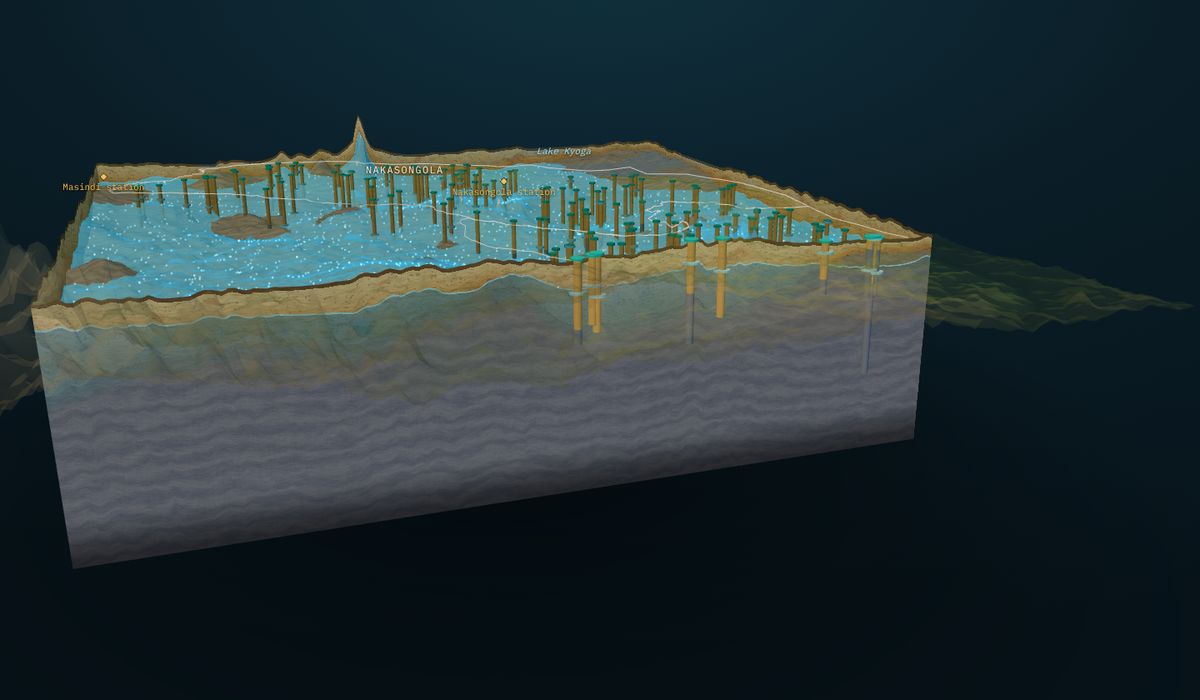
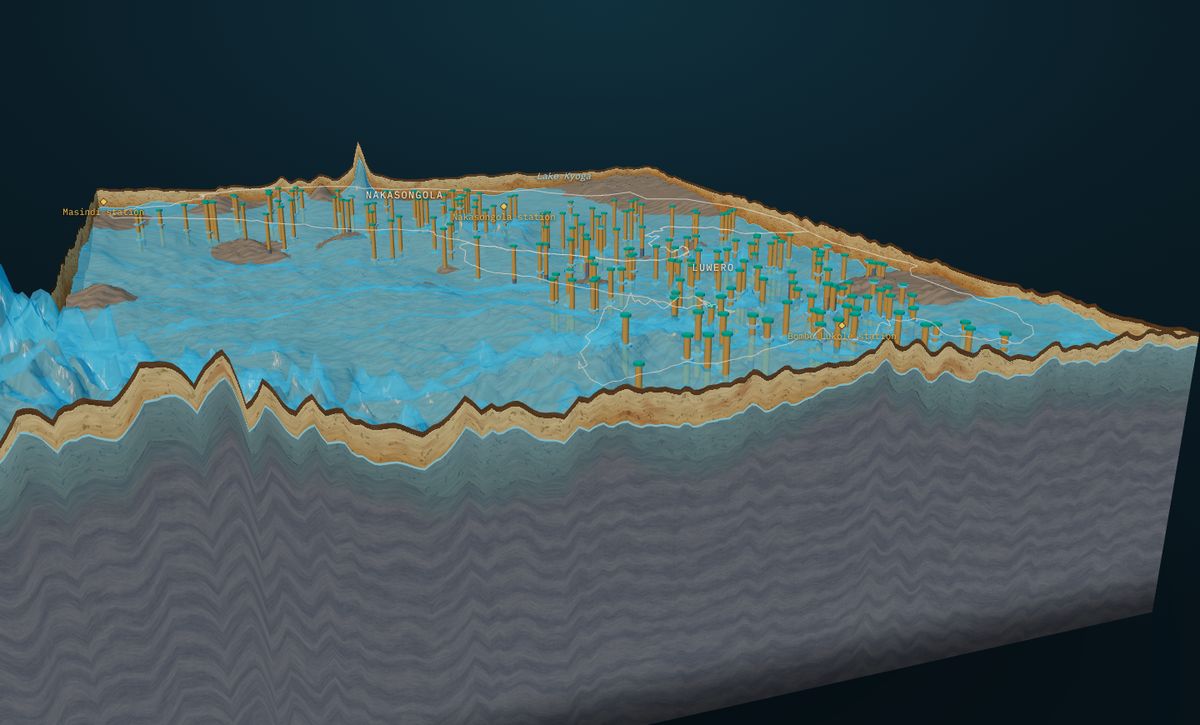
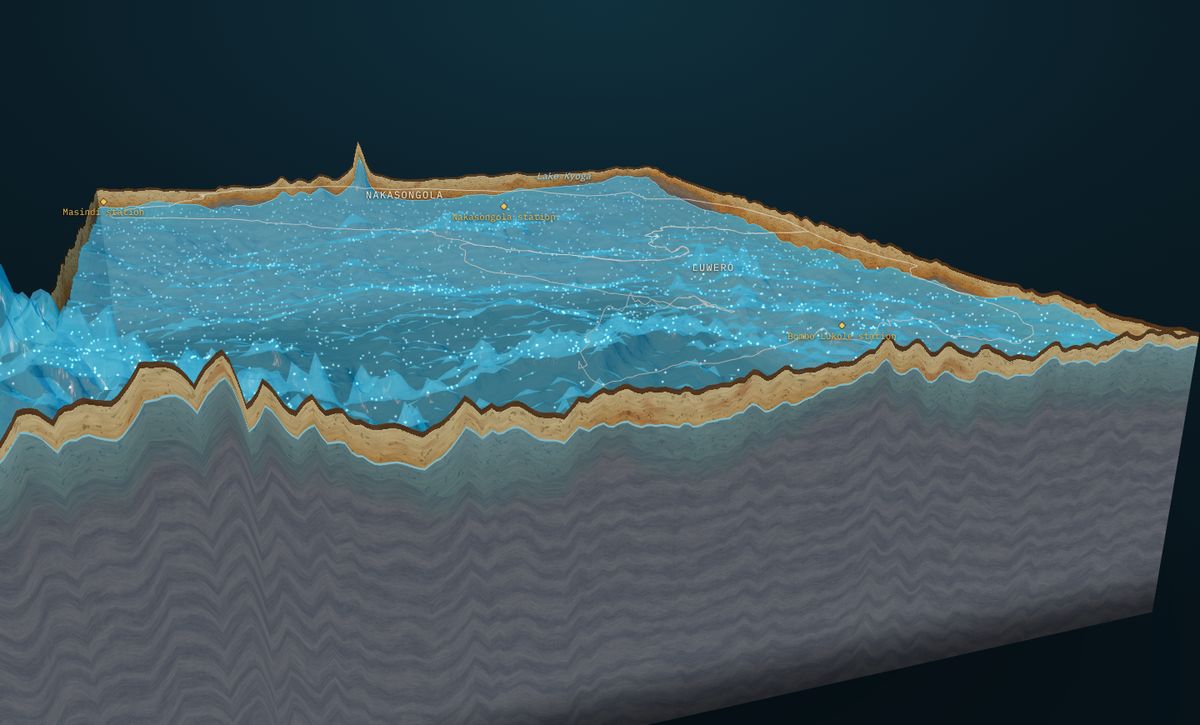
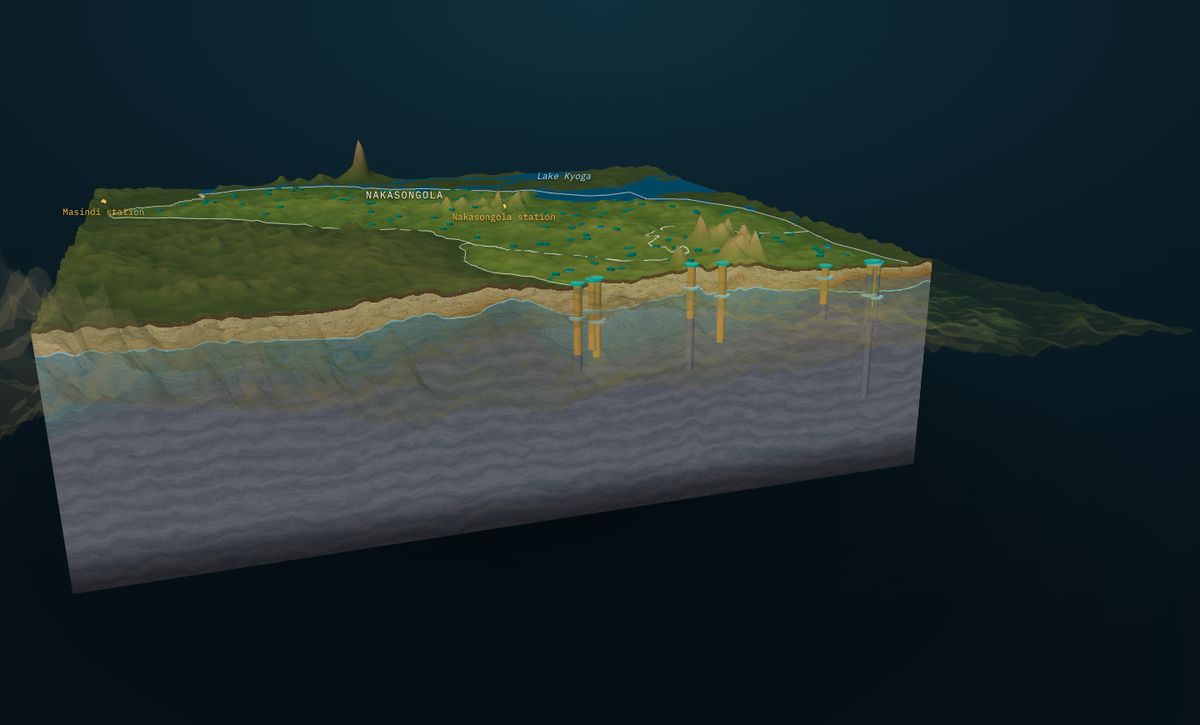
GroundWater Analyst turns those records into a 3D model of the aquifer. Water table and top of bedrock are interpolated between boreholes under the real terrain; soil, regolith, the saturated zone, weathered rock and bedrock are built into a block you can turn, cut and question; every borehole is drawn with its depth, bedrock contact, water level and yield; and groundwater flow is animated on the water table.
The model runs in any browser, phones included, so the planner, the driller, the funder and the community see the same thing. It is updated as new records arrive, and every surface can be downloaded for GIS. The result: boreholes sited from evidence, drilling depths planned in advance, and data gaps that are visible rather than hidden.
Why choose GroundWater Analyst?
The only way to see your aquifer in 3D from the records you already hold, shared with a link.
- Records into 3D. Drilling logs and water levels become one model you can turn and cut
- Decide where to drill. See where water is shallow, bedrock deep and records scarce
- Shared with a link. Runs in any browser, no licences or GIS training
- Method you can defend. Interpolation, grid and data counts stated; thin data flagged
- Kept current. Quarterly updates as new boreholes are drilled
GroundWater Analyst workflow
A step-by-step guide from your data to a result you can act on.
Borehole records
Your drilling logs, water levels and yields, or records licensed from the data owner.
Quality control
Check, clean and georeference every record.
Terrain
A digital elevation model sets the ground surface.
Interpolation
Water table and top of bedrock on a regular grid, smoothed.
3D aquifer block
Soil, regolith, saturated zone, weathered rock and bedrock under the terrain.
Groundwater flow
Flow follows the gradient of the water table and is animated.
Web delivery
A private or public link, maps, sections and a short report.
Key features of GroundWater Analyst
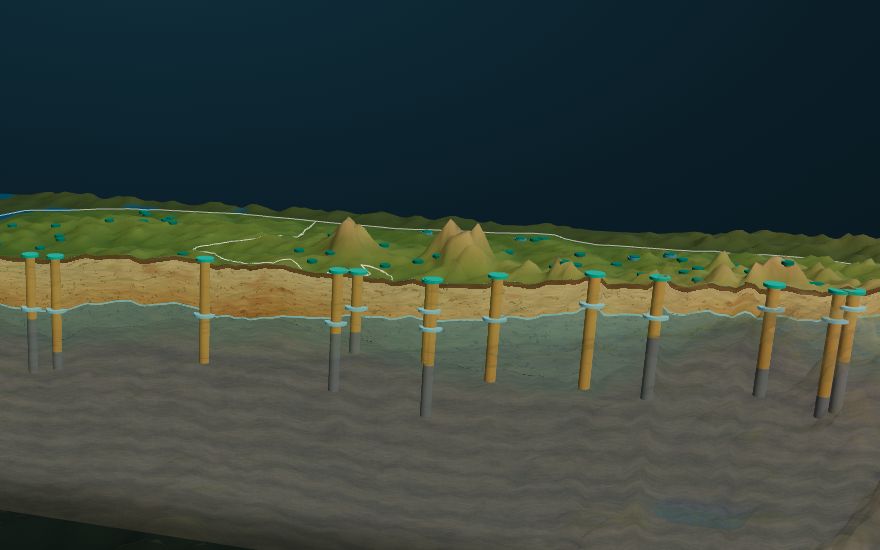
- Cross-sections anywhere. West–east or south–north, slid across the area; nearby boreholes drawn on the face
- See-through and hidden ground. Reveal the water table and every borehole at once
- Borehole details. Tap a borehole for depth, bedrock, water level and yield
- Separate exaggeration. Terrain relief and depth scales set independently, with scale bar and compass
- Animated flow. Groundwater direction on the water table
- GIS downloads. Water table, bedrock and sections for your own tools (Professional and up)
- Phone-ready. Controls fold into a bottom sheet for field use
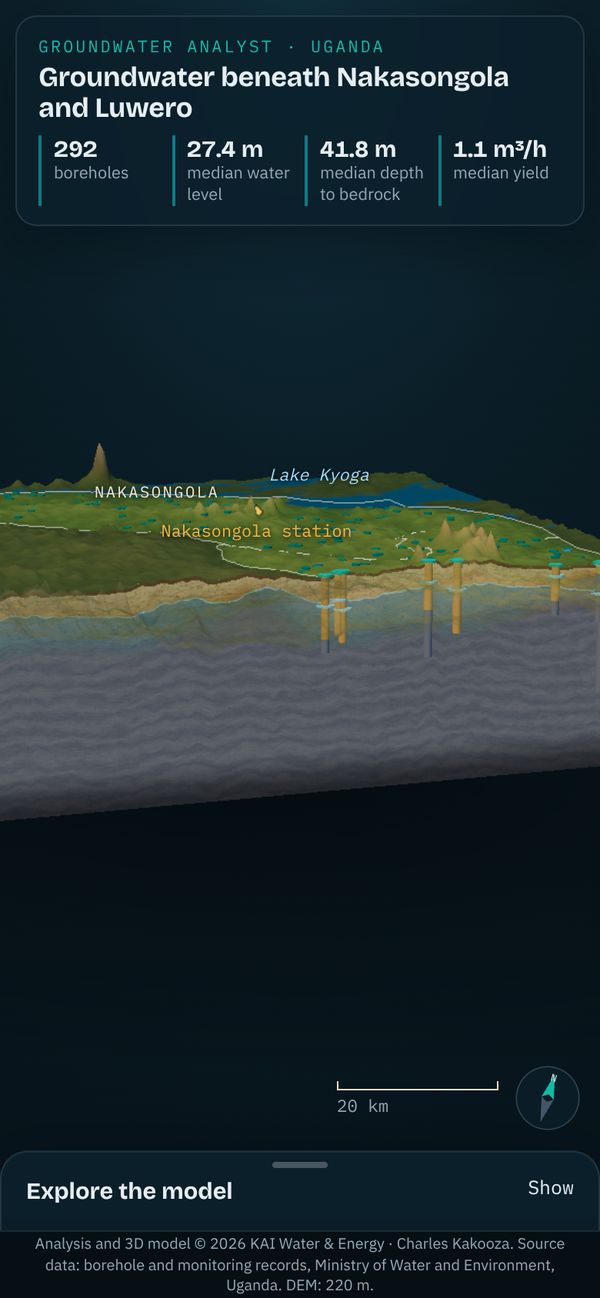
GroundWater Analyst in the cattle corridor: Nakasongola and Luwero
Pastoral and farming communities here rely on boreholes in weathered crystalline basement. Yields are low and depths vary widely, so a dry borehole is an expensive mistake.
- 292
- boreholes analysed
- 27.4 m
- median depth to water
- 41.8 m
- median depth to bedrock
- 1.1 m³/h
- median borehole yield
What the product delivered
- A 3D aquifer block for both districts under real terrain
- Water-table and bedrock surfaces on a 600 m grid
- Cross-sections with every nearby borehole drawn on the cut
- Groundwater flow directions, published at a link
What it shows
Most boreholes draw from a thin saturated band in the weathered zone. The model shows where that band thickens and where it nearly disappears.
Three regions in one model
- Central cattle corridor: 292 boreholes, Nakasongola and Luwero
- South-west cattle corridor: 72 boreholes, Isingiro, Mbarara, Kiruhura and Kazo
- Aswa catchment: 387 drilling logs with 1,870 layers, Kitgum and Pader
Published research
The science behind GroundWater Analyst is published as an open book chapter: Groundwater intelligence for Uganda's cattle corridor (Nafula and Kakooza, 2026). It maps water levels, depth to bedrock and yields from 7,306 boreholes in 2D and 3D, models daily levels at 18 monitoring stations, and sets station-specific Standardised Groundwater Index thresholds as drought triggers for bulletins, anticipatory action and abstraction permits.
Model © KAI Water & Energy · GroundWater Analyst · Borehole records: MWE WEIS Groundwater database
Drilling odds for any site
The Heterogeneity Lab in GroundWater Analyst: models of the ground between wells, the yields neighbours got, and a blind test, turned into one answer per site.
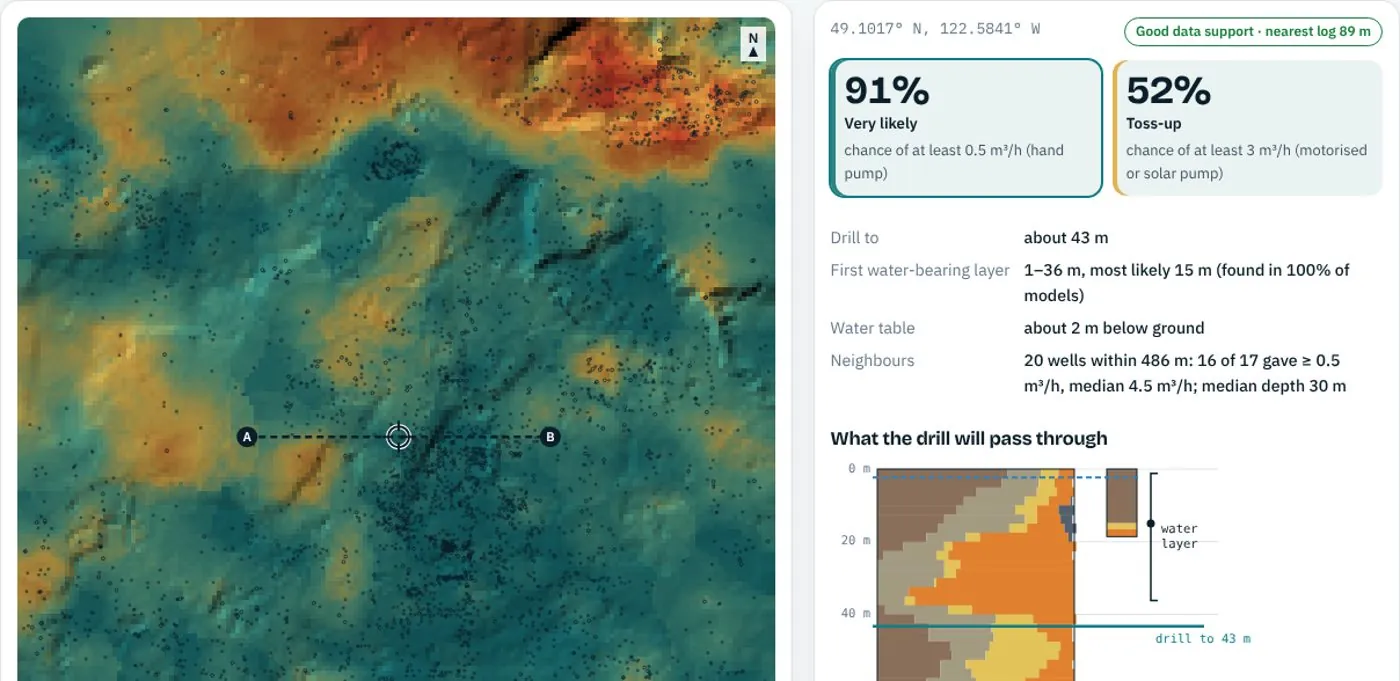 Heterogeneity Lab · drilling odds · tested blindTap a site, get the drilling answerThe chance of at least 0.5 m³/h (hand pump) or 3 m³/h (motorised pump), the depth to the first water-bearing layer, how deep to drill and what the drill will pass through, from the ground models between wells. Tested on 595 wells it never saw: it ranks wet and dry sites with an AUC of 0.83, and its stated chances match what happened.Open the demo → Run it on your boreholes (sign in) →
Your own GroundWater Analyst workspace
Create an account, customise the product to your operation and own it for daily work. KAI runs everything behind it: storage and database, the knowledge base, and the software that schedules and runs your model jobs. The front end is yours from day one.
Your account, your product
Open a free account, pick the product and switch it on. Your sites, users, thresholds and layers are set up for you, and the front end is ready the same day.
Customised, then yours to run
We shape the product to your operation: the points you watch, the reports you file, the alerts your team needs. Your team runs it every day; your data stays yours and exports at any time.
Storage and database, handled
Time series, maps, logs, models and files kept in one managed database, backed up, secured per user and shared only as you decide.
A knowledge base that grows
Your reports, methods, data sources and model documentation in one searchable place, so a new engineer finds why a number is what it is.
Workflows that run themselves
Model runs, data pulls, quality checks and alerts are scheduled and queued for you, every day, with a log of each run.
A team on call
We keep the models calibrated, add data as it arrives and answer within two working days. You get a modelling team without hiring one.
GroundWater Analyst plans
Start free. Move up a tier when it pays for itself. Paid plans are invoiced; pay by bank transfer or mobile money.
Explorer
See what a groundwater model shows before you pay for one.
- Explore the public 3D models
- Method notes and data guide
- One area check: we tell you what records exist
- Product updates by email
Site Check
One borehole site, checked before you drill.
- Depth to water and to bedrock at your site
- Cross-section through the site
- Nearby borehole records summarised
- PDF report in 5 working days
Professional
Your own private 3D model, kept up to date.
- Private 3D model of one district or wellfield
- Quarterly updates as new records arrive
- GIS downloads: water table, bedrock, sections
- 4 Site Checks a year included
- Up to 5 users
Premium
For programmes, utilities and multi-district work.
- Several districts or a national programme
- Live water levels from monitoring wells
- API access and data exports
- Named specialist and team training
- Service-level agreement
Prices in US dollars, excluding VAT. Annual plans: pay for 10 months, get 12. Compare all plans · Login
Interested in GroundWater Analyst?
Contact our team today for a demo on your own data, or start free now.
Guides on this topic
GroundWater Analyst: questions and answers
What does GroundWater Analyst answer?
Where the water is before you drill: depth to water and to bedrock at a site, a cross-section through it, and the chance of finding enough water (drilling odds) from 3D groundwater models built on borehole records.
Who is GroundWater Analyst for?
Anyone about to pay for a borehole or plan many: drillers and their clients, water programmes, utilities and multi-district work. One site can be checked for a fixed price; a district or wellfield gets its own private 3D model.
What data do you need from me?
For a Site Check, the location of the site. To run drilling odds on your own area, upload driller's logs as CSV: one row per logged interval (well id, top and bottom depth, description), plus well locations; yields and water levels make the answer sharper. The Lab needs at least 15 wells with a location and a log.
How accurate are the drilling odds?
Tested blind on 595 wells it never saw, the drilling-odds model ranks wet and dry sites with an AUC of 0.83, and its stated chances match what happened. The test and its data are published with the Heterogeneity Lab.